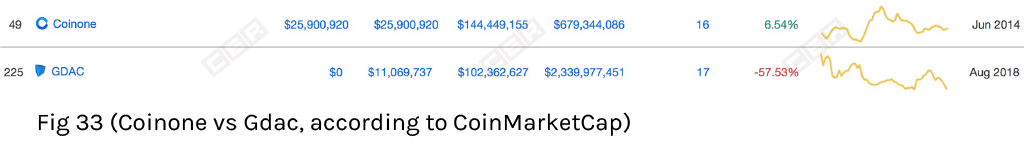
Coinbit and GDAC are two newly created exchanges that were launched this summer in South Korea. Following the latest trends, both platforms have their own tokens and employ a trans-fee mining model for incentivizing its users to spend more time trading on their platforms. Since GDAC’s trade fees are 0% the exchange redistributes its tokens ‘based on contribution for buy orders’ and calls it a ‘Purchase Contribution Air Drop’, but the principle is the same as trans-fee mining (rewarding the trading activity). In a similar way to other crypto exchanges that have adopted this controversial type of trading incentive, Coinbit and GDAC have received an impressive boost to their trade volume. Thus, both of them broke into the CMC Top 10 by 24h reported trade volume in late October. Interestingly, Coinbit even outpaced Binance and BitMEX to gain 1st place on the Coin Market Cap (CMC) rank on November 12 (see fig 1).
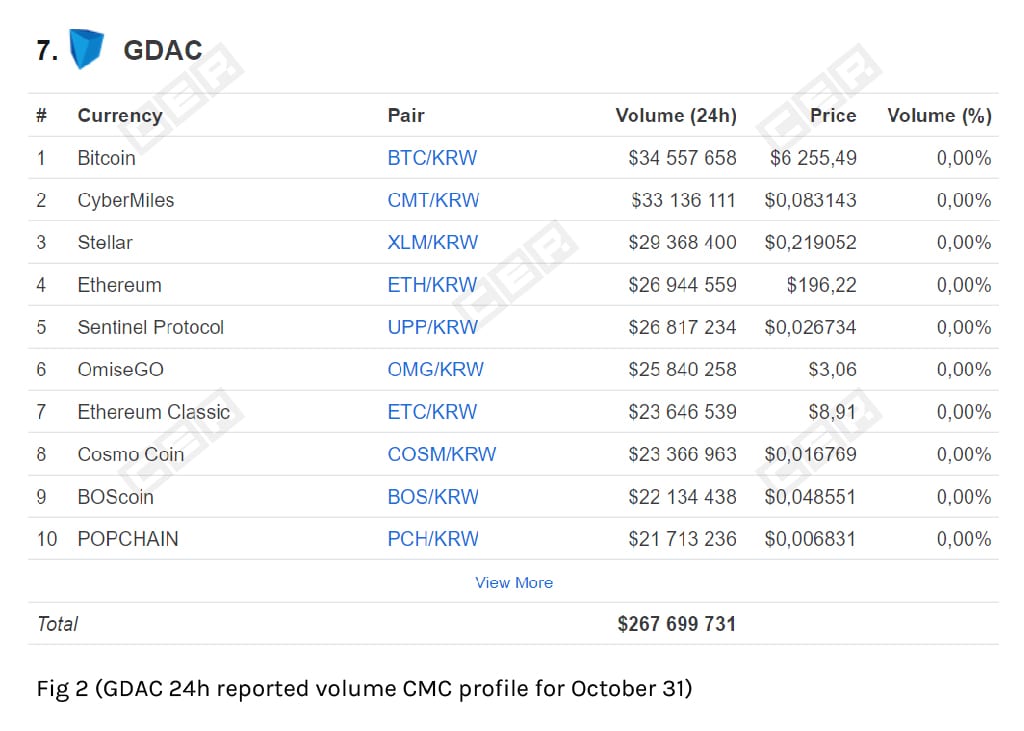
In turn, GDAC seemed to be more a little more realistic than Coinbit as its best result was ranking 7th place on CMC rank with $267 mln 24h trade volume on October 31 (see fig 2).
Considering the immediate success of these two newly founded Korean exchanges, we decided to take a closer look at them both.
Liquidity Analysis
In fair markets, trade volume tend to be evenly distributed over periods of regular price performance and experiences a substantial rise during times of significant price swings.
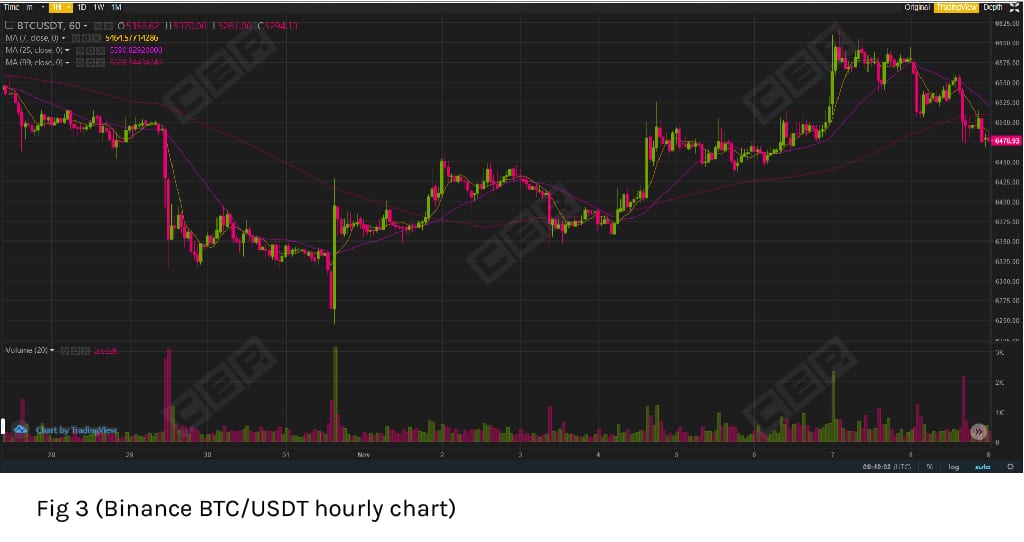
To begin with, Fig 3 shows an illustrated example of natural trading activity on Binance.
When suspecting exchanges with trade manipulations, we look for signs and patterns that are uncommon for normal markets. Some of them show obvious inconsistencies between price moves and trade volume performance, as well as irregularly large volume spikes of hundreds and even thousands of times higher than average market value. Not surprisingly, we usually detect such uncommon signs of unnatural trading activity while investigating literally all new exchanges that report millions and even billions of dollars of trade volumes in just few months after their launch. Coinbit and GDAC are not the exceptions. Let’s take a look at some charts of their most active pairs.
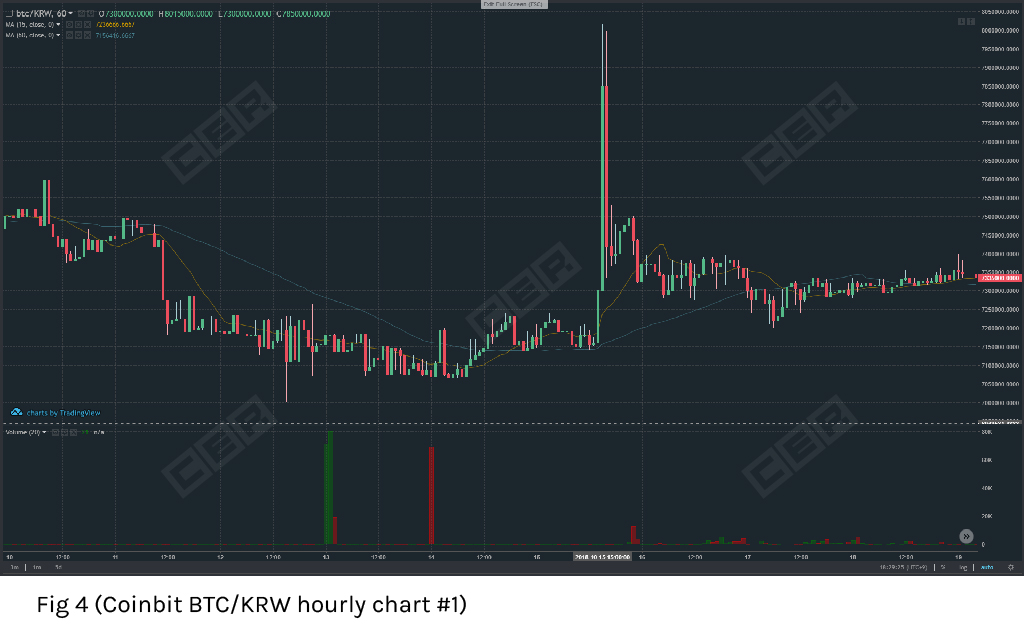
On BTC/KRW hourly chart of Coinbit (fig 4), one can see huge volume spikes up to 80k BTC through hours of nearly flat price move together with over 10% price jump on 21 BTC traded.
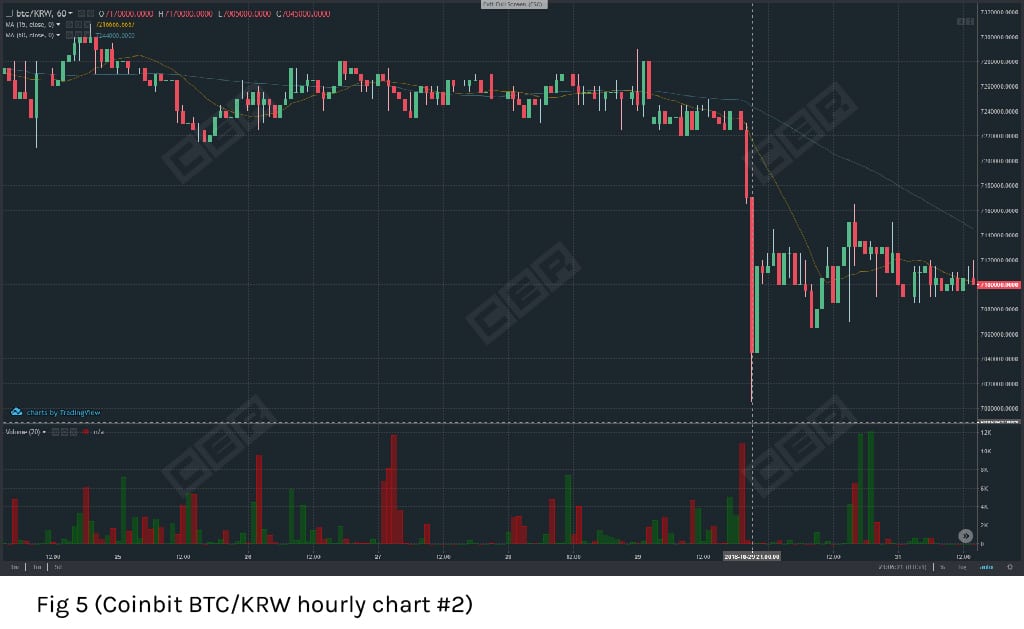
The next chart (fig 5) displays decent trading activity spikes of up to 12k BTC per hour during periods of sideways price moves, along with about a 2.5% 1-hour price slump for 40 BTC traded.
Moreover, smaller time-frame charts show such inconsistencies between price and volume performance more clearly (see figs 6-8).
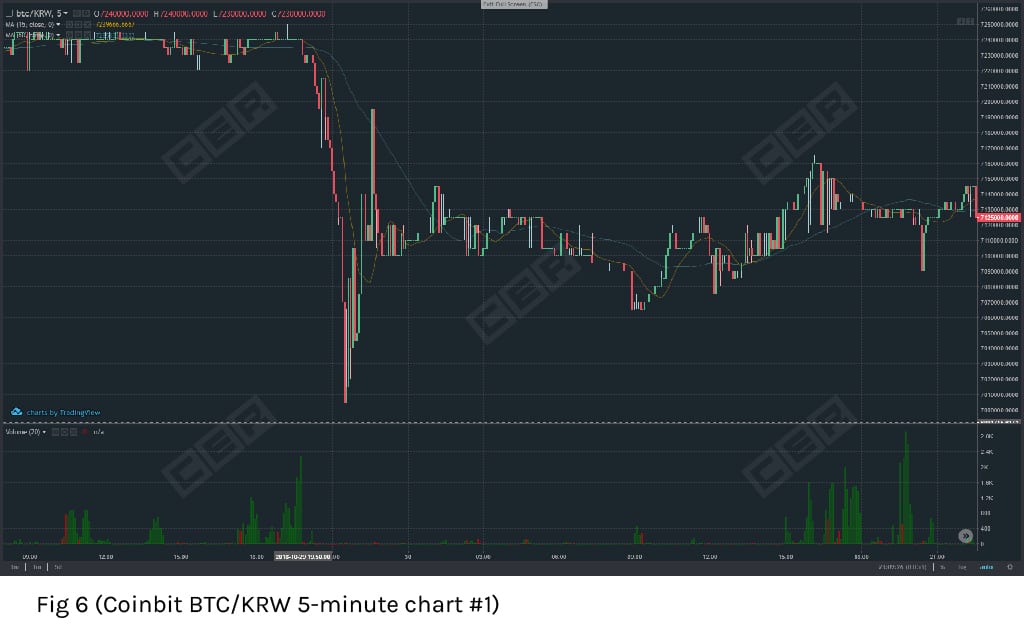
The first BTC/KRW 5-minute chart (fig 6) demonstrates in details the case pictured on fig 5 were price began sliding down just after trading activity dropped from 1-2 thousands to tens of BTC per 5 minutes. The price eventually slumped over 3% on the tiny trade volume when compared to the preceding periods.
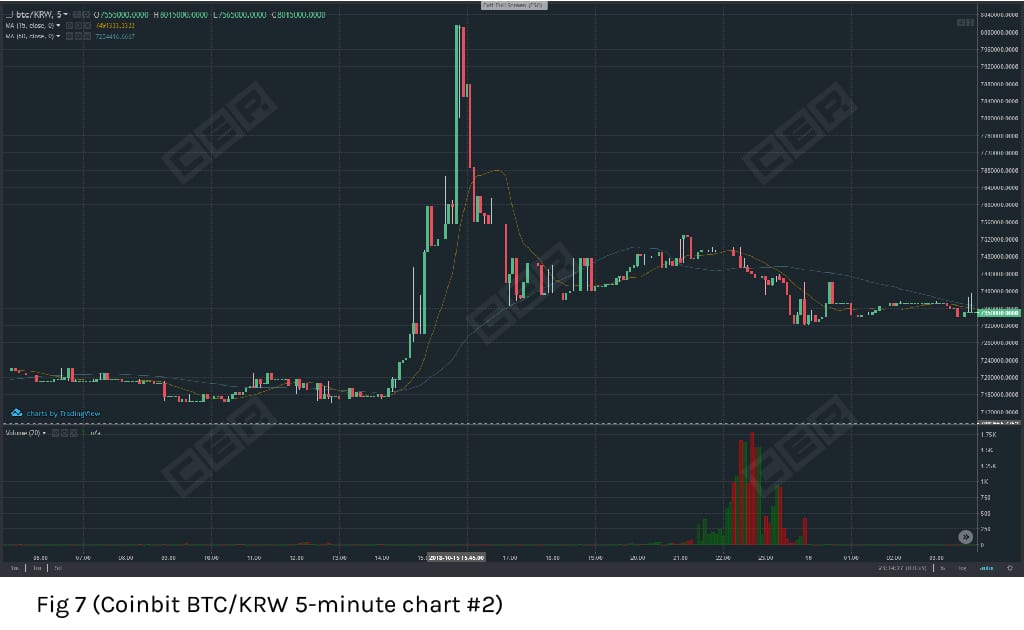
The next BTC/KRW 5 minutes chart (fig 7) shows high volatility period almost without trade volume, in particular, a 6% price jump in 5 minutes on only 2 BTC traded. And some hours later trading activity rose up to 1.75k BTC per 5 minutes during a smoothly moving price period.
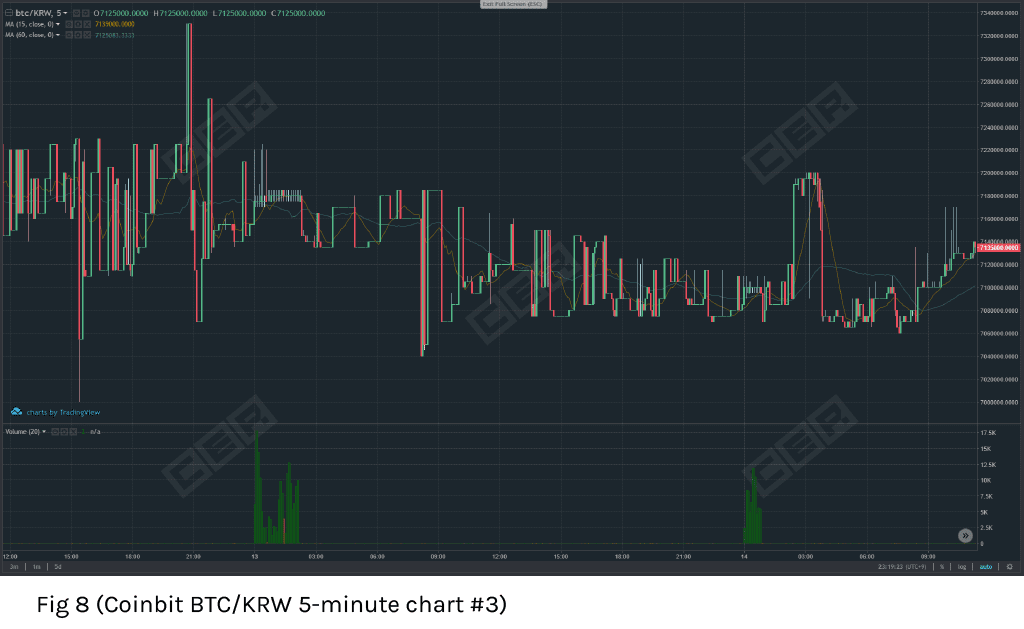
Another BTC/KRW 5-minutes chart (fig 8) shows price range tightening during two periods of irregularly high trading activity (up to 17.5k BTC per 5 minutes), along with stronger price fluctuations on minuscule trade volume.
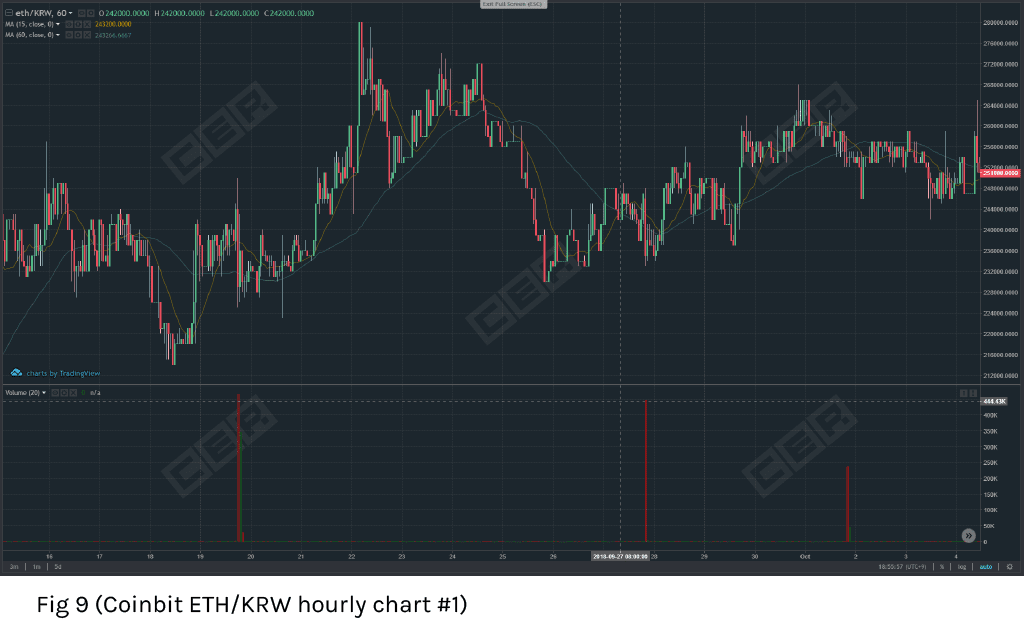
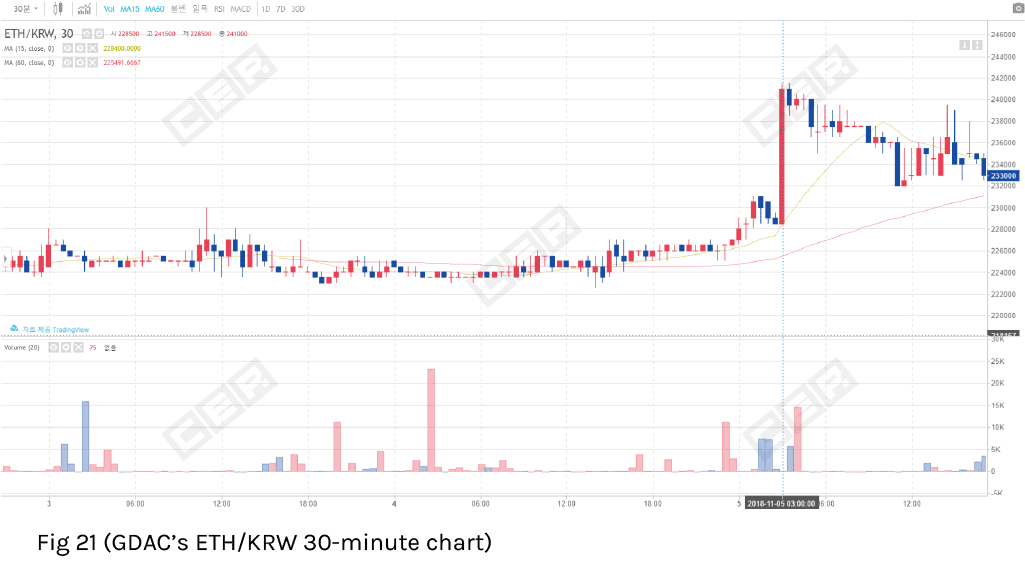
Next, ETH/KRW hourly chart (fig 9) demonstrates irregular, large volume spikes of 230-450k ETH per hour, while some hourly periods nearby have 0 volume.
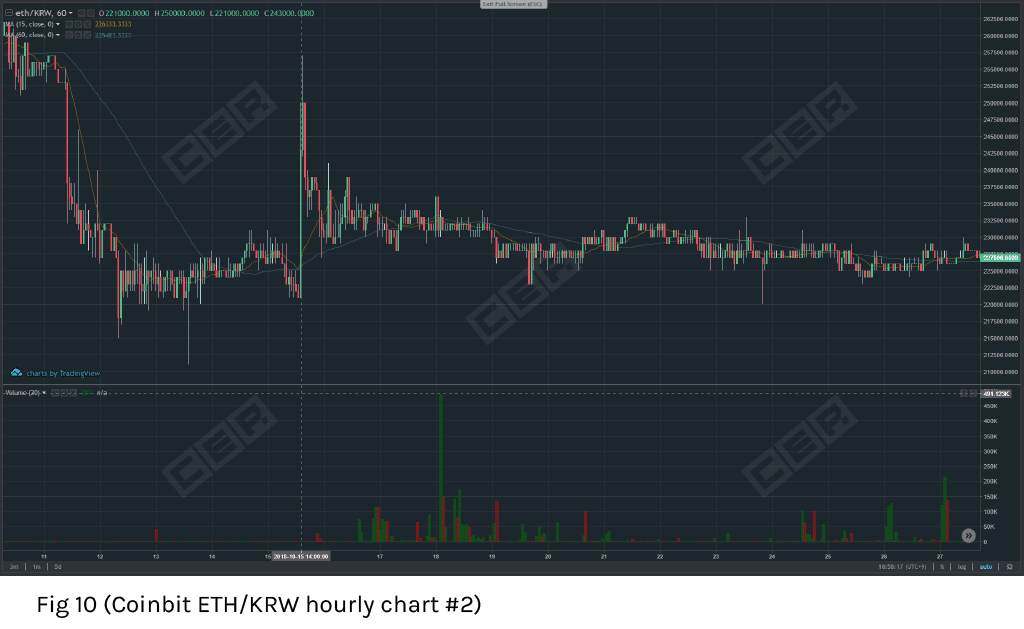
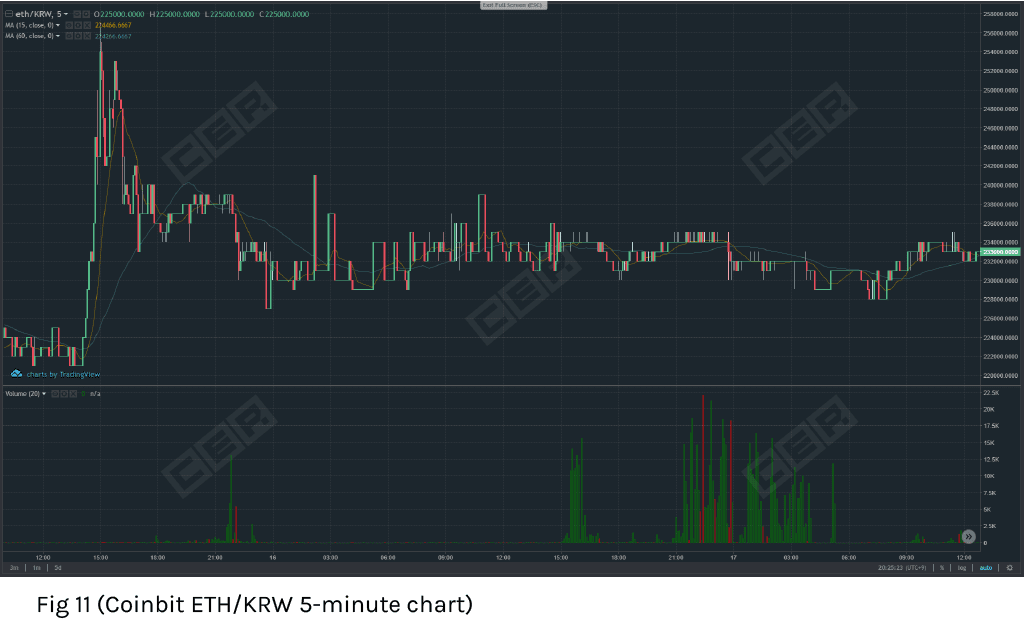
Another hourly ETH/KRW chart (fig 10) displays 10% price jump on 284 ETH traded together with numerous volume spikes of over 100k ETH per hour in low volatility periods. The next chart (fig. 11) shows how such inconsistencies look on a 5-minute time-frame.
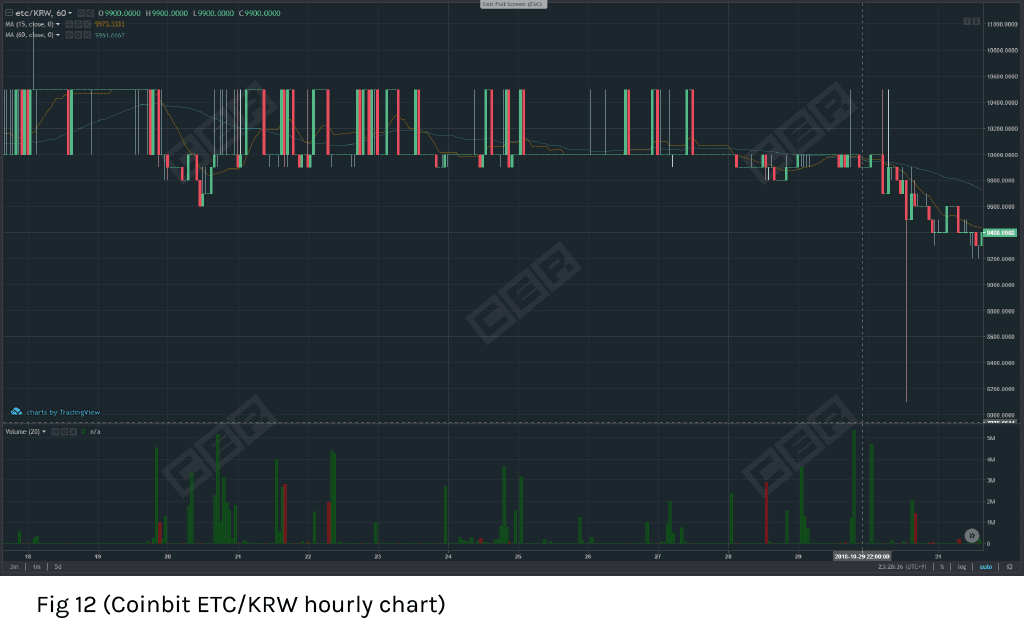
Similar inconsistencies of price and trade volume performance can be seen in other Coinbit trading pairs. An hourly ETC/KRW chart (fig 12) demonstrates numerous enormous hourly trade volume spikes of up to 5 mln ETC in tandem with 0 volume periods.
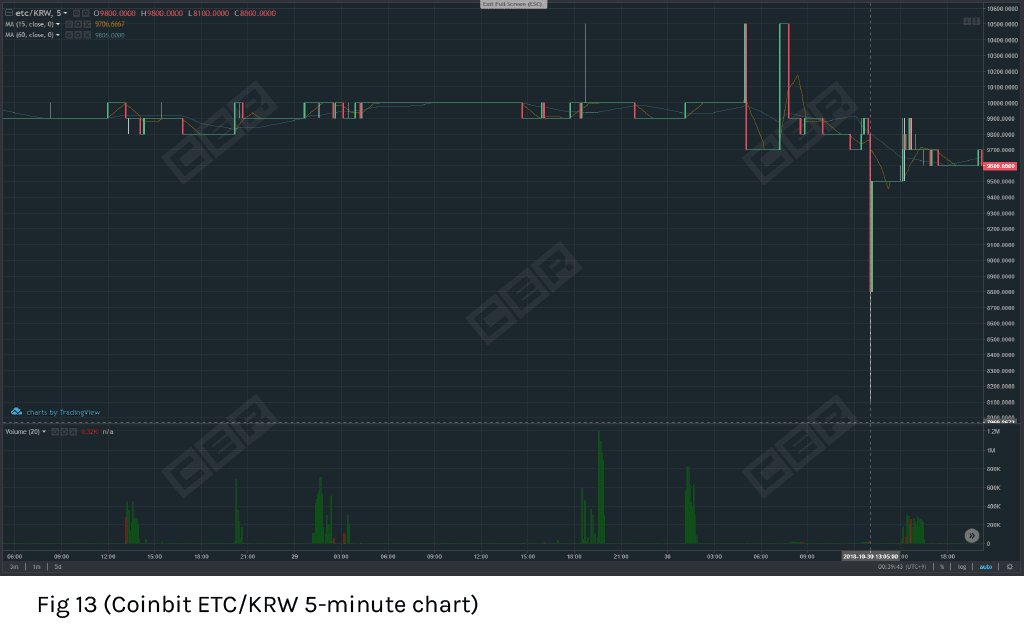
Fig 13 displays these irregularities on a 5-minute chart, including an over 17% price swing from high to low within 5 minutes on 6320 ETC volume, along with steady price periods with intensive trading activity ranging from 200k to over 1mln ETC per 5 minutes.
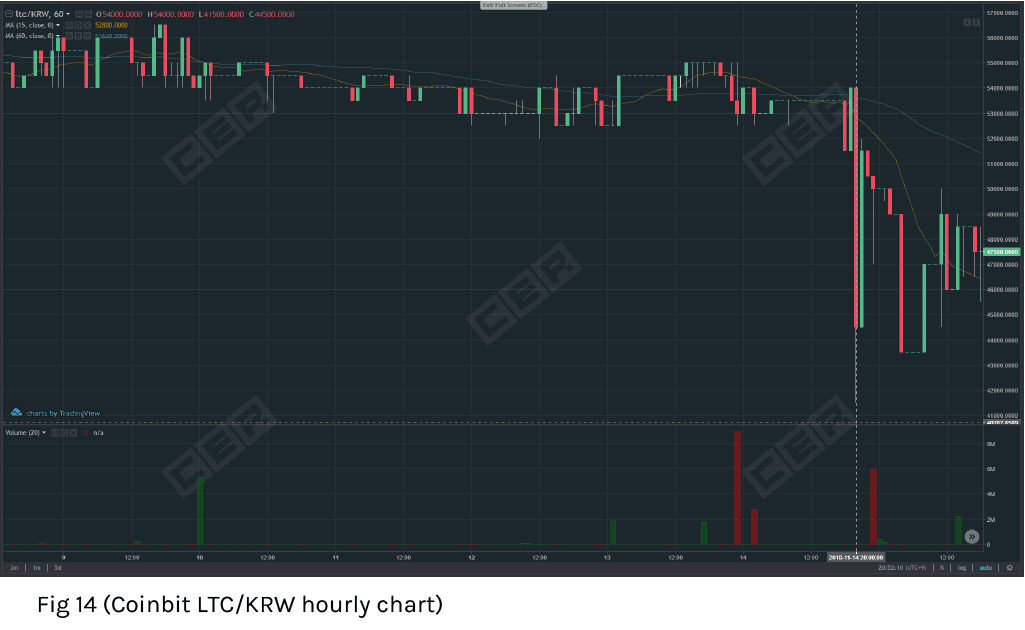
A similar condition is reflected in the LTC/KRW pair. Its hourly chart (fig 14) displays drastic price swing of more than 23% from high to low on only 12 LTC traded together with hourly volume spikes of 1.8 – 9mln LTC.
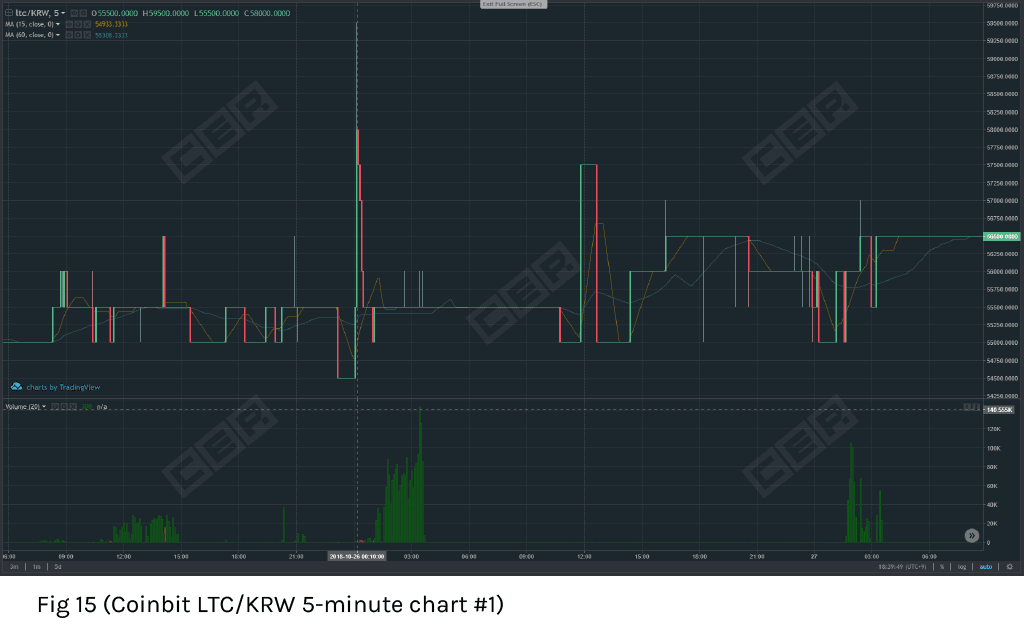
And again, over 7% price swing within 5 minutes for 300 LTC traded not long before trade volume jumped to 40-140k LTC per 5 minutes during steady price period (fig 15).
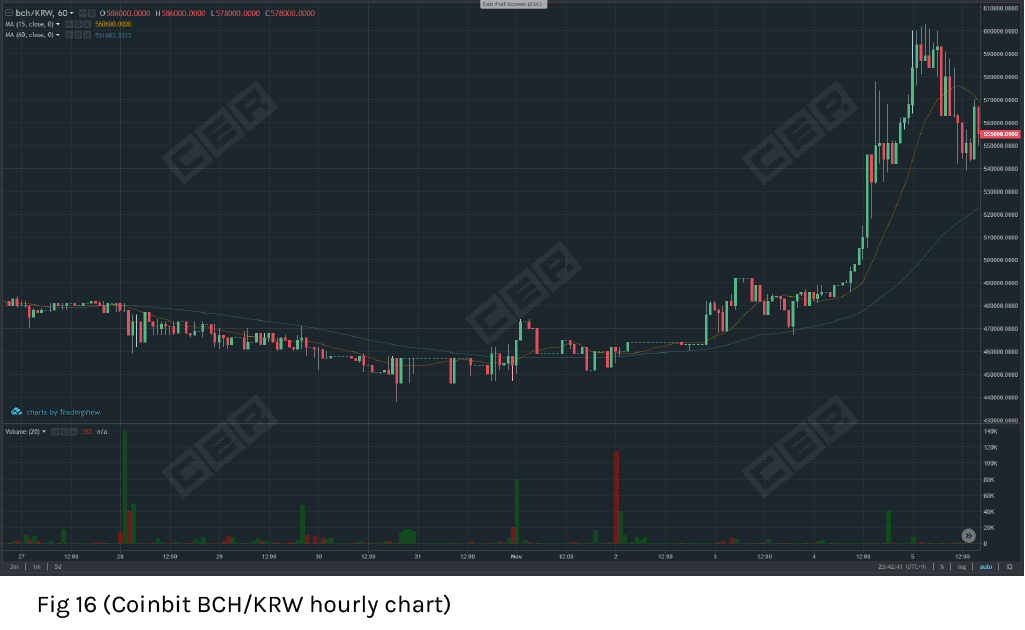
BCH/KRW hourly chart (fig 16) also shows high volatility periods with low volume and volume spikes of up to 140k BCH over steady periods.
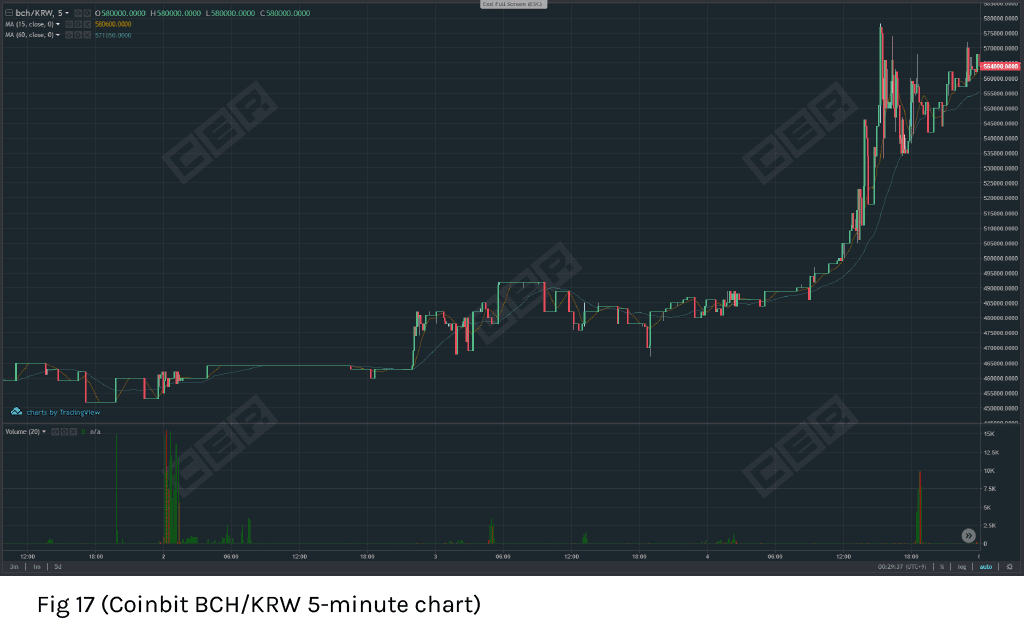
This is how it looks like on a 5-minute chart (see fig 17).
GDAC
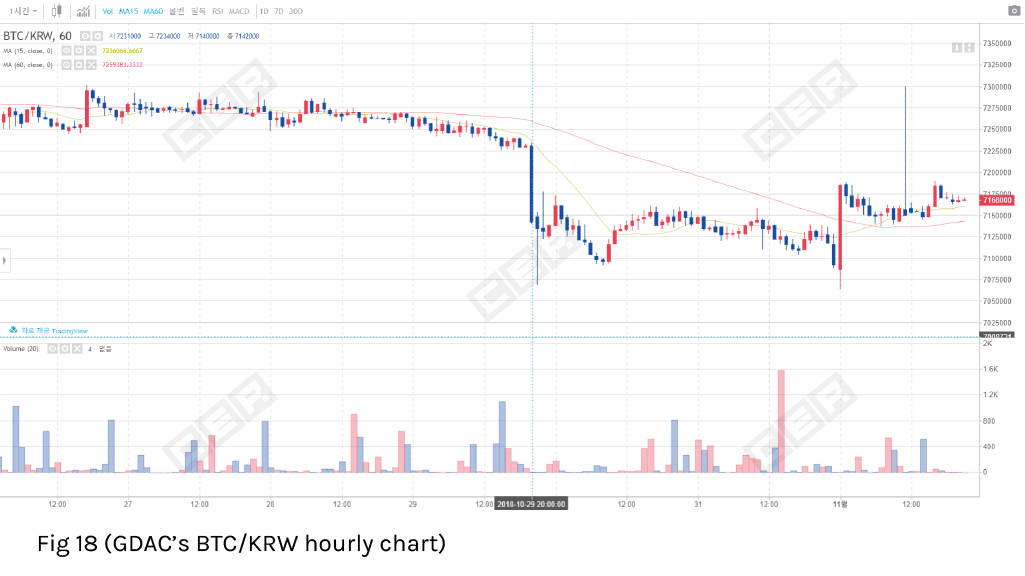
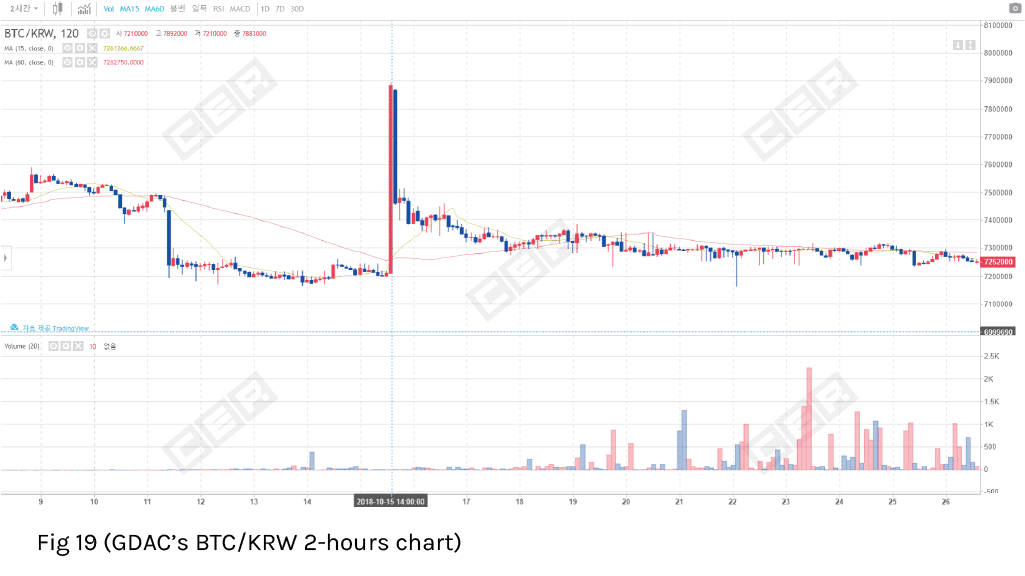
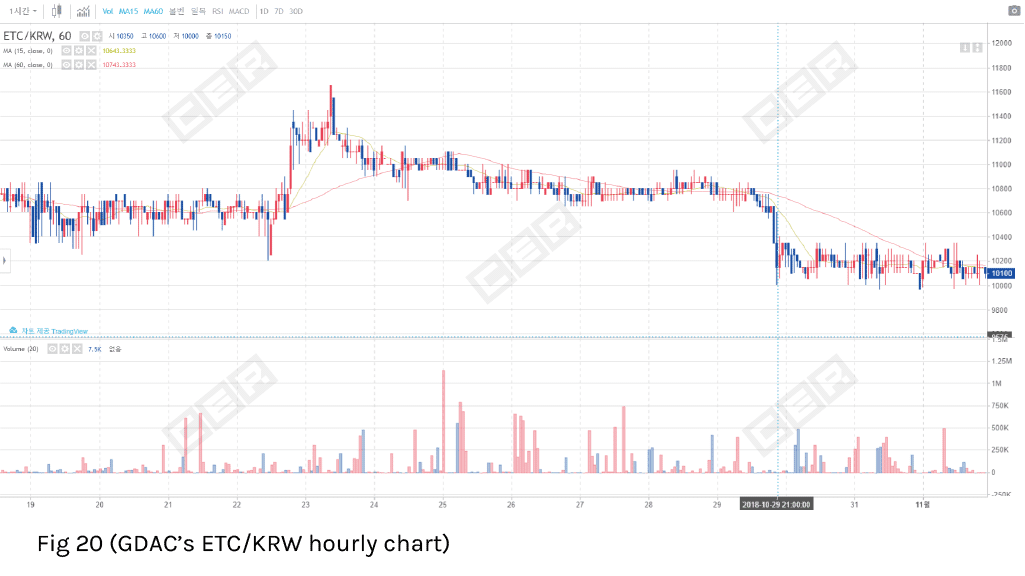
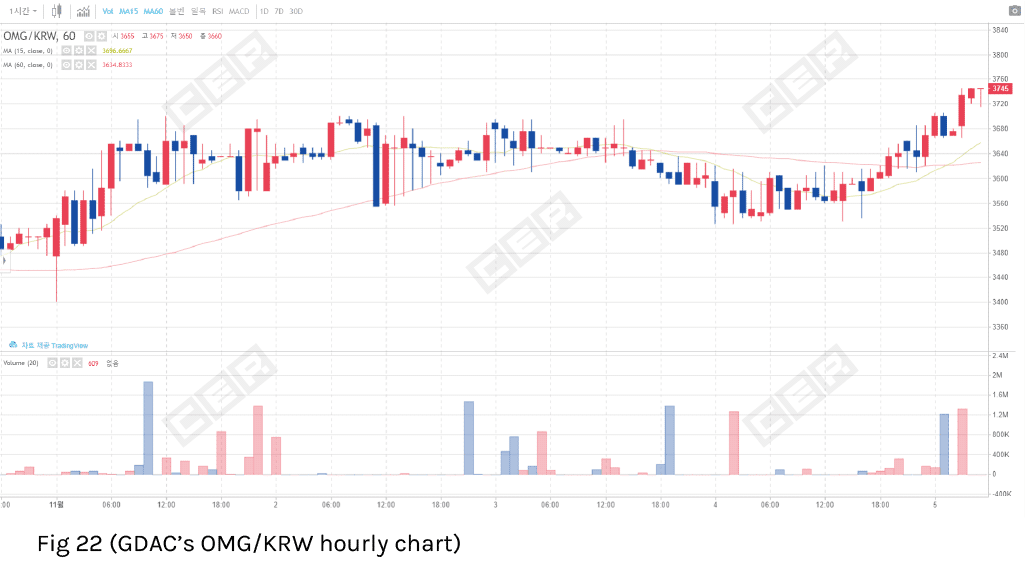
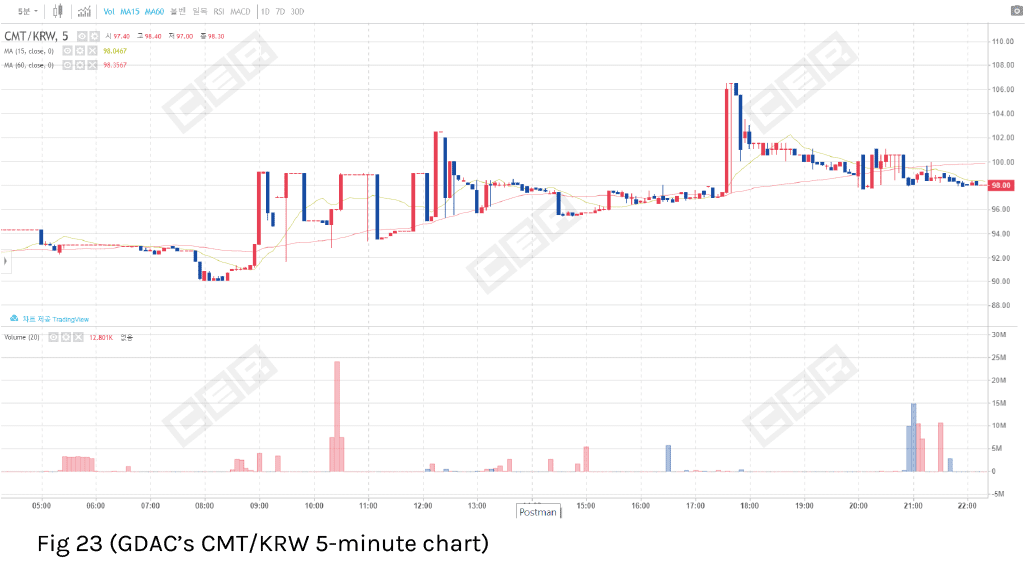
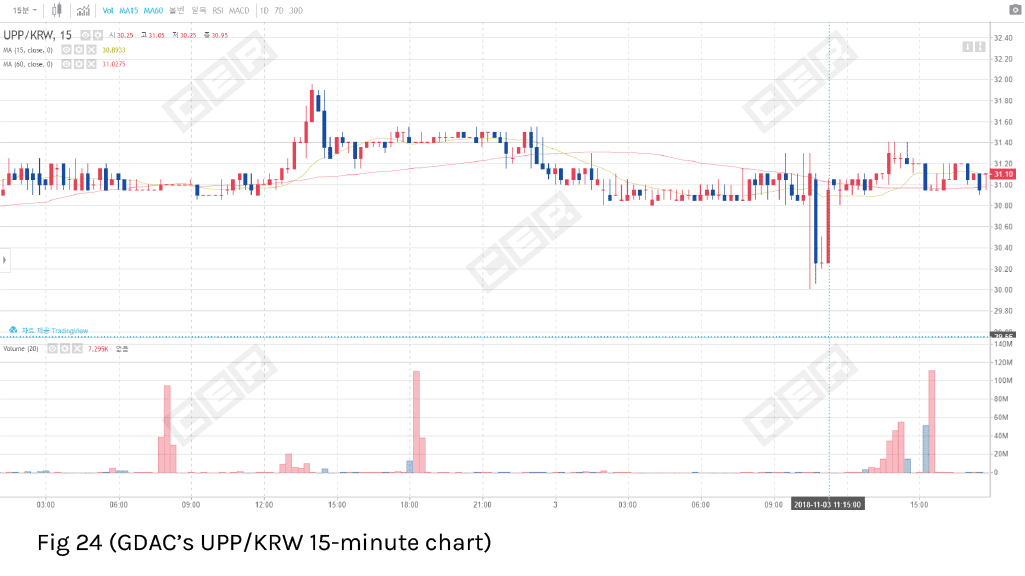
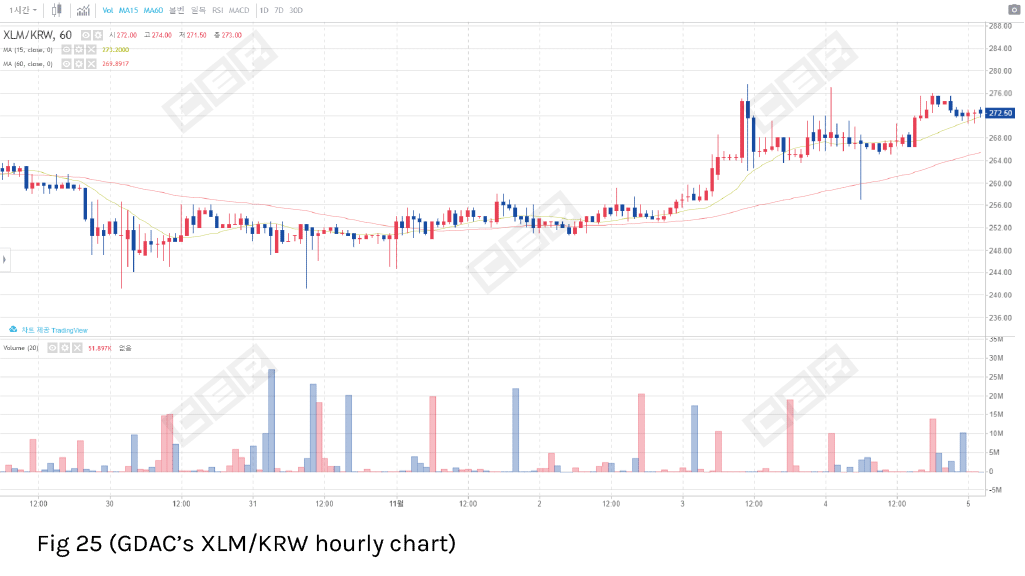
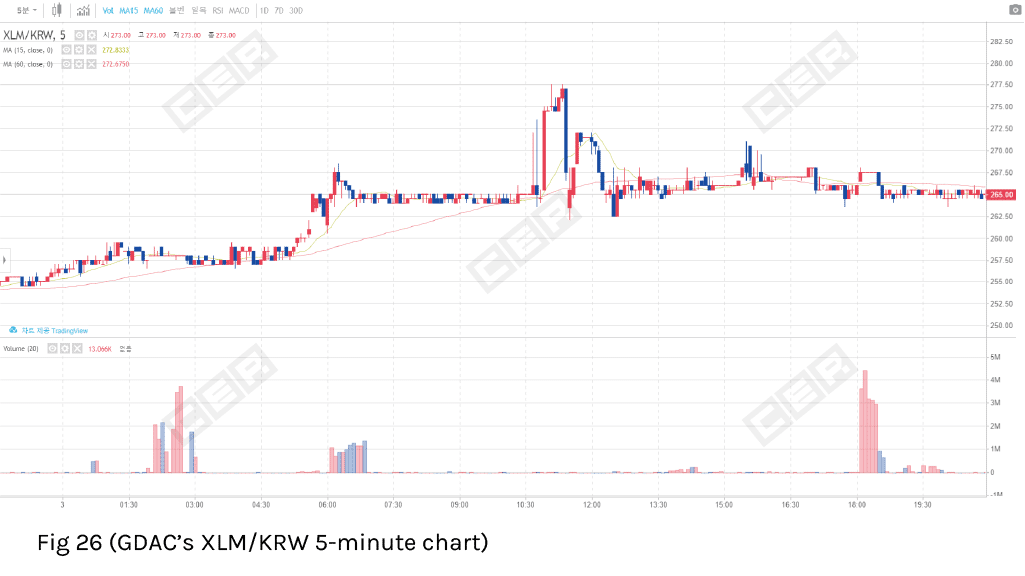
GDAC’s trade volume is much lower than on Coinbit but the number of inconsistencies is quite comparable. The exchange shows very similar irregularities of price and volume performance in all its major pairs and on various timeframes. We think that there is no need to describe GDAC’s screenshots in details as they demonstrate patterns of sharp price swings on low volume resembling those of Coinbit. Just look at the following screenshots (figs 18-26).
Besides the aforementioned irregularities, we also noticed that both exchanges reported abnormal trade volumes for particular coins.
First, it is worth noting that GDAC’s volume is more dispersed compared to Coinbit, as usually 99% of the exchange’s total volume is comprised of 10-15 coins, with single coin’s volume rarely exceeding 20% of the total. Coinbits’ volume is more concentrated since over 99% of the total is usually traded in 5-7 coins, with a single coin’s volume reaching over 50% of the total. At the same time, the liquidity on both exchanges permanently flows between different coins. Today’s leader accounting for 20-30% of the total volume may bring less than 1% tomorrow.
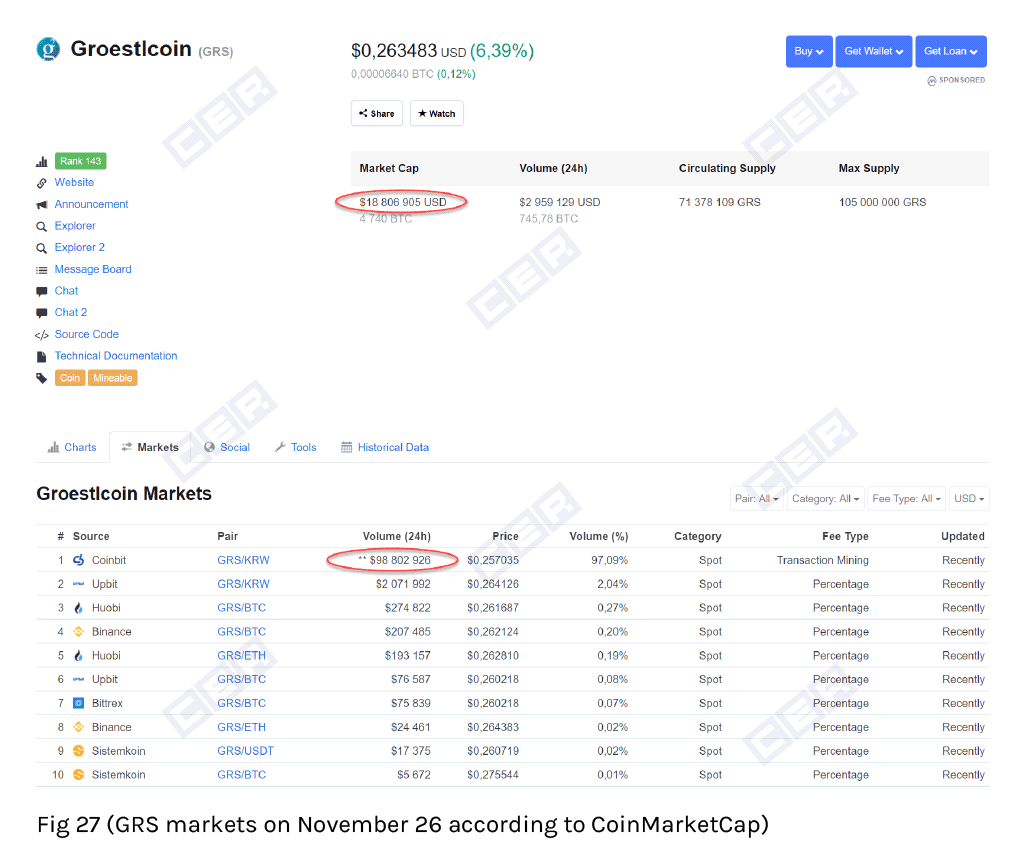
Moreover, total daily volume for a particular coin sometimes exceeds its capitalization by far.
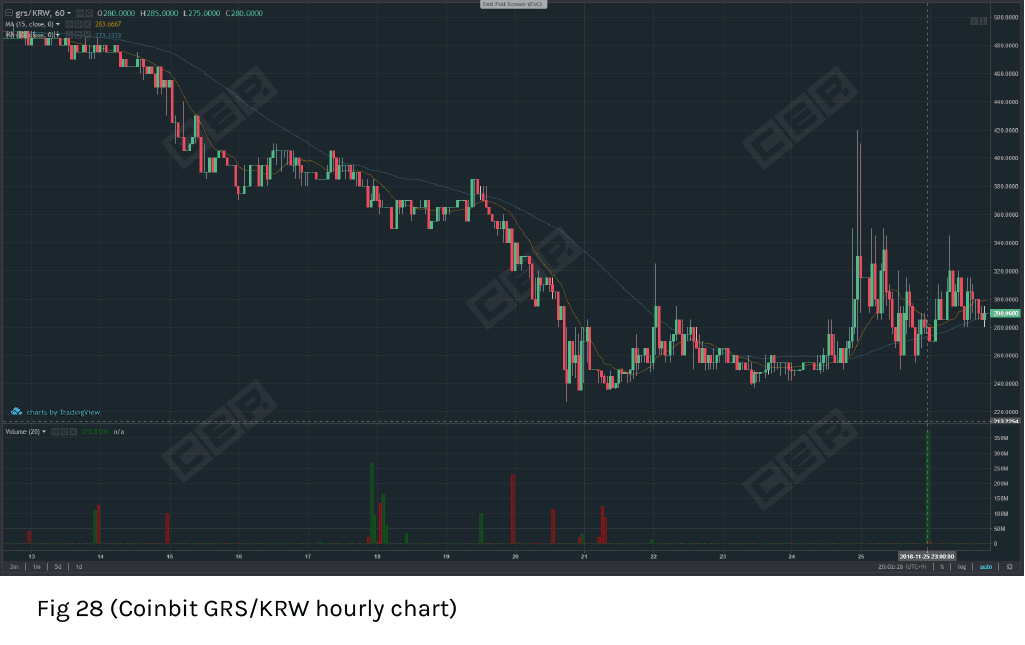
For instance, as for November 26, Groestlcoin’s 24-hours trade volume on Coinbit was 5.25 (!!!) times larger than its capitalization (see fig 27). That means if all GRS tokens were deposited on the exchange they would have been sold and bought more than 5 times. Here is what such trading activity looks like on an hourly chart (fig. 28).
On fig 28, one can see multiple hourly volume spikes exceeding GRS total supply (71.3mln coins) by far, and one of them by more than 5 (!!!) times.
Considering that usually only a fraction of total supply is deposited on a sole exchange the real turnover of GRS on Coinbit is definitely much higher than that. And since there are few chances to identify the exact number of deposited coins if the exchange doesn’t disclose it voluntarily, we can only assume that real GRS velocity on Coinbit could be tens, hundreds or even thousands of times larger.
What is such a high trade volume all about? Is it real trading activity or just mass flipping aiming to benefit from transaction mining and/or creating a false appearance of high liquidity?
And GRS volume is not the only example of such unreasonably high numbers.
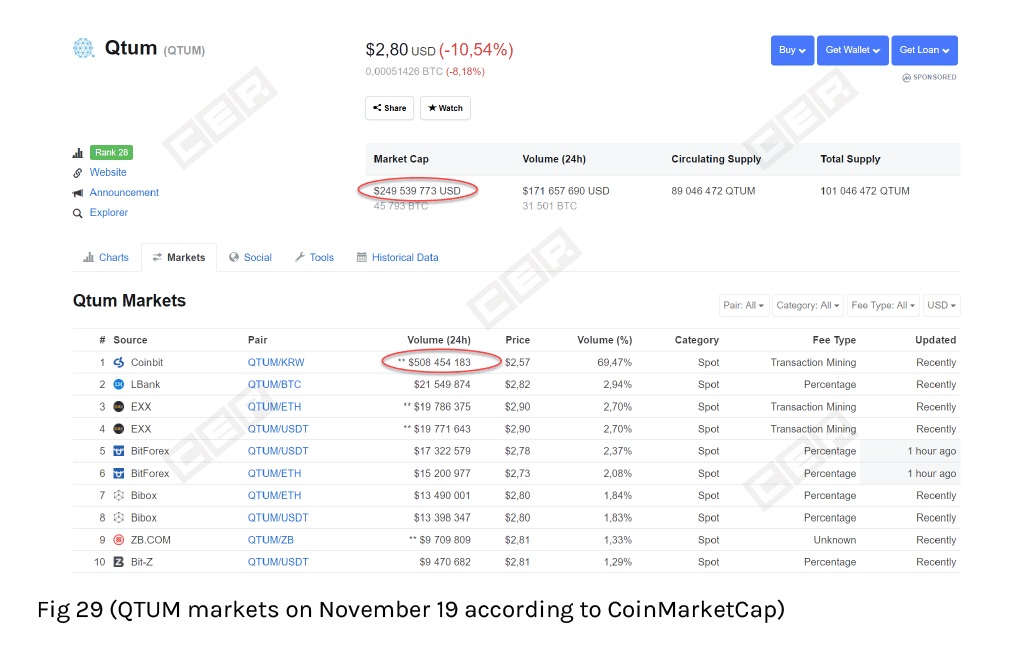
QTUM traded its capitalization twice on Coinbit on November 19 (see fig 29).
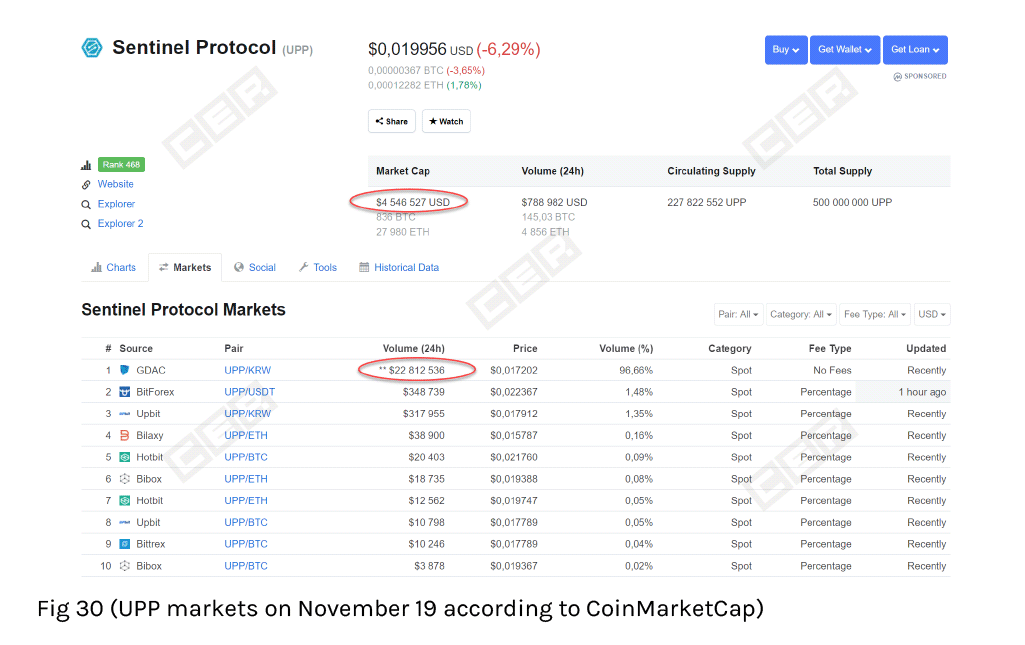
Similar things are happening on GDAC. Sentinel Protocol (UPP) was traded at 5 (!!!) times its capitalization on November 19 (see fig 30).
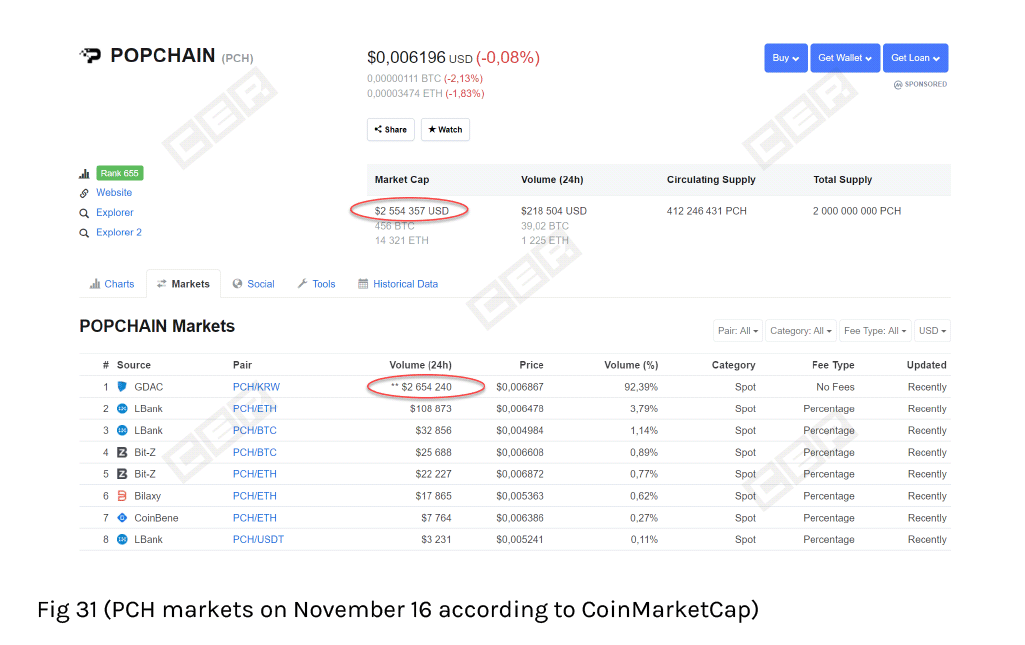
On November 19, trade volume of Popchain (PCH) slightly exceeded its capitalization (see fig 31)Thus, considering all our findings, in particular irregularly huge volume spikes and insane turnover of particular coins, it becomes clear that trading activity on both exchanges is artificially inflated apparently due to the trans-fee mining.
Marketing analysis
Our marketing analysis will be a bit unorthodox in this blogpost. We need to compare “apples to apples” and since we have two relatively large exchanges with two relatively small ones, we shall group them together in our marketing analysis. So each section will have “two parts”.
As you can see from Fig 34, Upbit has significantly more traffic than Coinbit. The drop in Upbit’s traffic can be explained by the general downward trend in crypto in the past 6 months. Coinbit was barely indexed by SimilarWeb before August, with average site visits at only 5000/month.
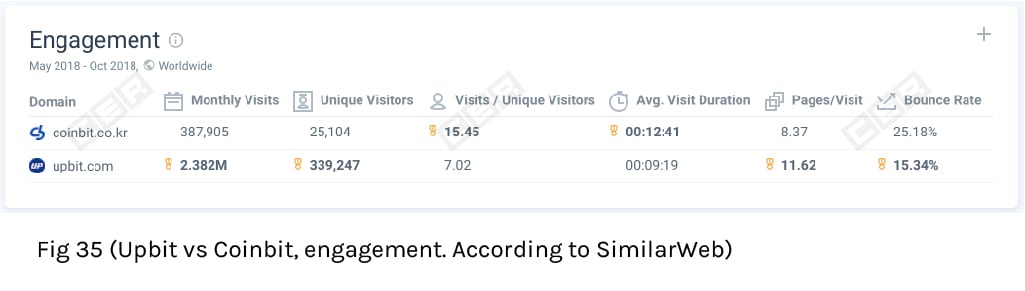
Engagement
We can see the sharp difference between Upbit unique visitors compared to Coinbit. Upbit has more than 10 times the number of UVs on it’s site.
It’s also weird to see that Coinbit users visit the site much more often than Upbit.
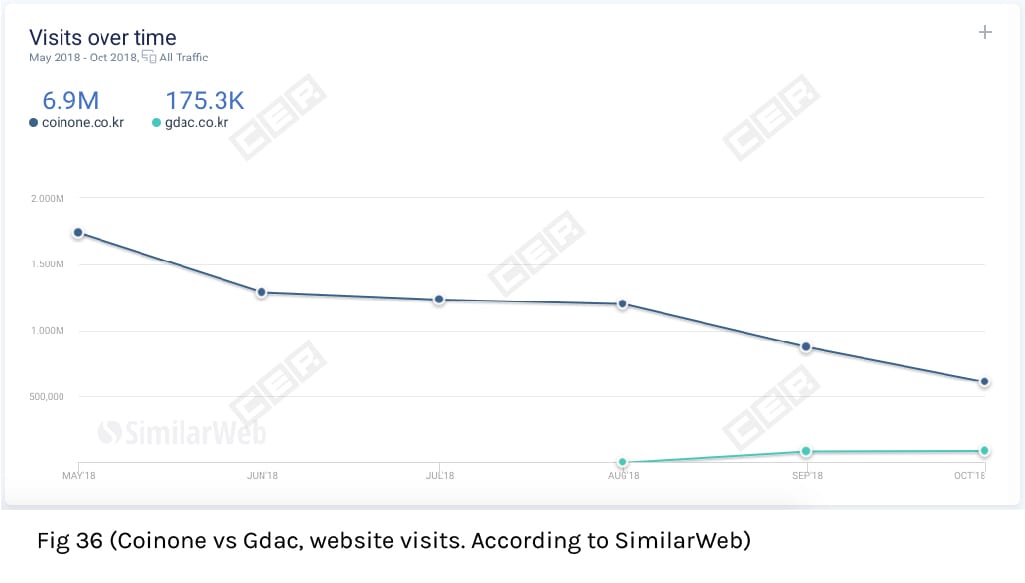
Website traffic
When it comes to website traffic, again we see a drop in traffic to Coinone. Both Coinone and Upbit lost around 75% of their respective traffic in the past 6 months. At the same time, Coinbit and GDAC, miraculously grew their traffic despite the drop in activity due to the Bitcoin downfall. That said, even Coinone is still miles ahead from GDAC.
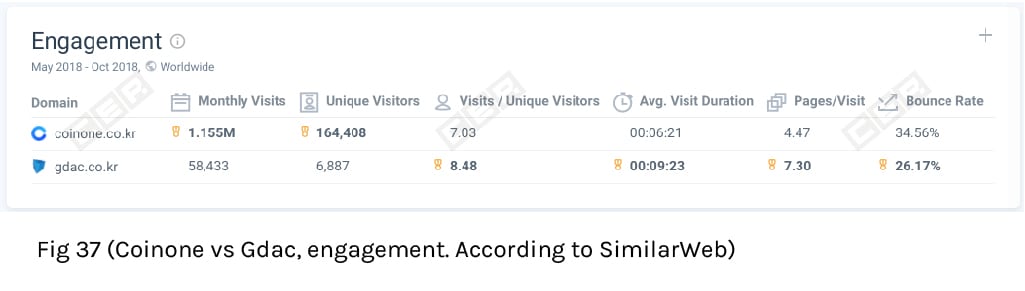
Engagement
We see the same situation with our second group. GDAC wasn’t even noticed by SimilarWeb before August. GDAC is simply incomparable to Coinone when it comes to unique visitors. GDAC has 30 times less UVs on its site.
Trade Volume Comparison
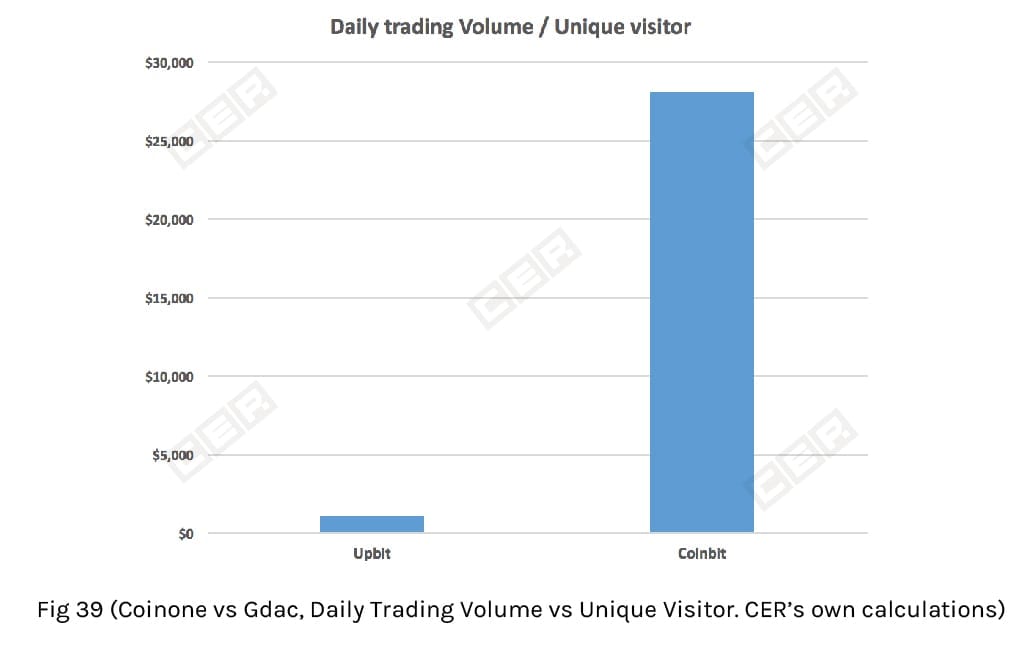
As we’ve said before, we take the “Reported” daily trading volume from Coinmarketcap.com (data – 29/11/2018). We then divide this number by the unique visitors from the SimilarWeb data. Here’s what we have as a result: We found radical differences between the two. Coinbit generates more than 10 times Daily Trading Volume than Upbit.
The case with GDAC is even more dramatic. They have very little traffic compared to Coinone. And while it’s only been three months since it was indexed by SimilarWeb, they have more than 10 times trading volume per unique visitor compared to Coinone. That is very suspicious.
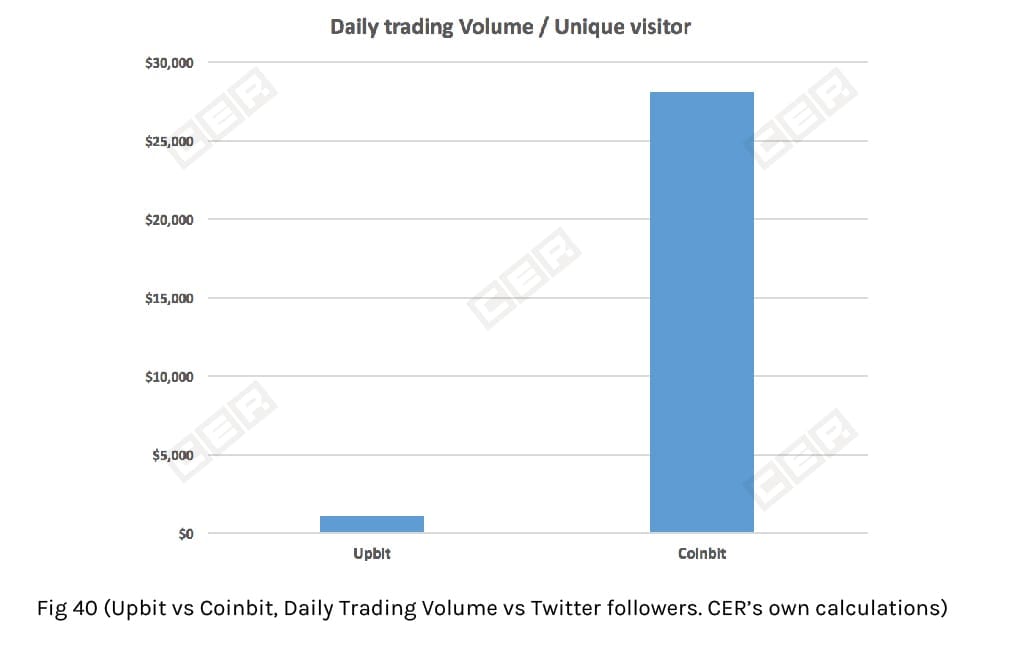
Trade volume vs twitter followers
Here are the twitter followers numbers for the exchanges we are analyzing:
Upbit – 17.2K Cointbit – 3,200 Coinone – 17.7K GDAC – doesn’t have a twitter account
Only Coinone and Upbit have an active twitter community. Coinbit is far behind. GDAC, not only doesn’t have a twitter account – it doesn’t have any active conventional social media channels to communicate with its audience.
Let’s compare the trading volume vs twitter followers, to see how Coinbit compares to Upbit.
As we can see, the results are very similar to trading volume / unique visitors. Coinbit vastly outperforms Upbit. Which begs the question – what is the reason behind such an impressive $/user KPI?
GDAC doesn’t even have a twitter account, thus we can’t even compare it to Coinone in terms of active community.
Conclusions
Our liquidity analysis revealed multiple irregularities of trade volume performance on both investigated exchanges: Coinbit and GDAC. The low volumes during significant price swings indicate synthetic yet insufficient liquidity. Huge volume spikes over quiet markets and immense turnover of particular coins several times exceeding their total supply offer the primary signs of wash trading. Thus, we consider trade volumes on Coinbit and GDAC most likely manipulated.
In turn, there are two clear conclusions that we have deduced from our marketing analysis:
(1) Coinbit appears to be pumping its trading volume. Their Reported Daily Trading Volume er unique visitor ($28,130) are off the charts compared to Upbit ($1,108) in both cases (website traffic and number of twitter followers).
Their “reported” numbers show that an average Coinbit user trades 10 times more than an average user of Upbit. We interpret this fact as confirmation of our conclusion that Coinbit’s Daily Trading Volume numbers are not genuine.
(2) It is the same with GDAC. It is nowhere near on the map from a marketing point of view. It barely has any traffic on its website and it doesn’t have any social media presence. Despite all that, their Daily Trading Volume per unique visitor ($2,164) is more than 10 times higher than Coinone ($143). This simply doesn’t add up.
All of the information represented above suggests that there are most likely prominent trade volume manipulations carried out on the Coinbit and GDAC exchanges.
What should the global crypto community do to eliminate the fraud of exchanges and make the industry mature?
The blockchain industry has been grappling with scalability issues, which have hindered widespread adoption due to its technical constraints. As the demand for blockchain, decentralized applications (dApps), and transactions increases, the limitations of existing networks become increasingly apparent. High transaction fees and network congestion have plagued platforms like Ethereum, hampering their ability to support large-scale
The experimental semi-fungible token standard, ERC-404, combines elements from ERC-20 and ERC-721 tokens. Despite rising popularity, it has yet to secure an official Ethereum Improvement Proposal (EIP) designation. However, its unique attributes, such as enabling fractional ownership of NFTs and enhancing liquidity, coupled with the potential for automated NFT minting and burning processes, suggest a
Decentralized applications (dApps) are software that run on a decentralized network, often using blockchain technology. These applications can serve various purposes for end users, such as brokers, art collectors, traders, investors, and documents of public trust. However, their functionality and value attract malicious groups aiming to exploit vulnerabilities for financial gain. This article explores real-world examples of dApp security breaches, their attack vectors, and the lessons learned.